
Launched in 2014, Make in India completes 12 years | Current Affairs | Vision IAS

Upgrade to Premium Today

Start Now
MENU
Home
Quick Links

High-quality MCQs and Mains Answer Writing to sharpen skills and reinforce learning every day.

Watch explainer and thematic concept-building videos under initiatives like Deep Dive, Master Classes, etc., on important UPSC topics.

A short, intensive, and exam-focused programme, insights from the Economic Survey, Union Budget, and UPSC current affairs.

ESC

In Summary

  • Make in India aimed to boost manufacturing via investment, innovation, and infrastructure, achieving significant production increases in electronics, pharmaceuticals, steel, defence, and capital goods.
  • Shortcomings include marginal GVA share increase, flattened exports, falling private sector GFCF, underused capacity, skewed credit growth, and stagnant manufacturing employment.

In Summary

Guided by ‘Minimum Government, Maximum Governance’, Make in India initiative focused on facilitating investment, fostering innovation and developing world-class infrastructure to promote manufacturing in India.

Achievements of Make in India 

  • Electronics: Production increased from ~₹1.9 lakh crore to ~₹13.11 lakh crore in 2025-26.
  • Pharmaceuticals: India’s pharmaceutical industry ranks 3rd globally by volume.
  • Steel: Crude steel production increased from 81.7 million tonnes to 170.0 million tonnes in 2025-26.
  • Defence: Value of indigenous defence production increased from ₹46,429 crore to a record ₹1.78 lakh crore in FY 2025-26.
  • Capital Goods: Production increased nearly twofold from ₹2,87,233 crore in 2019-20 to ₹5,69,900 crore in 2024-25. 
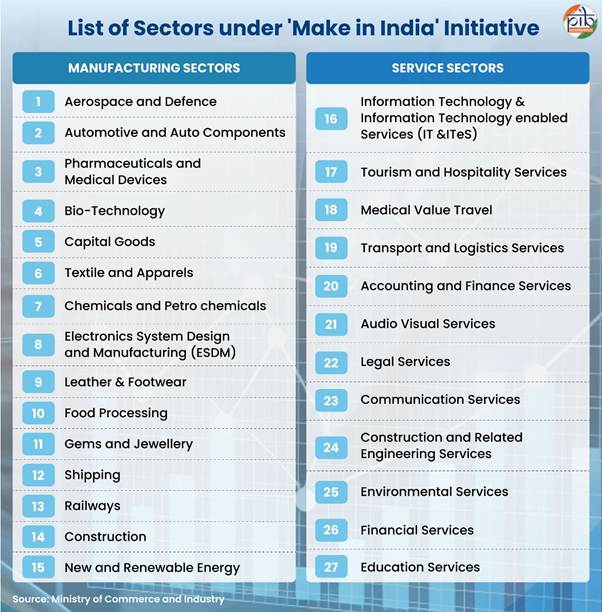
Shortcomings in Make in India

  • Marginal Improvement: Manufacturing sector’s share in overall GVA increased marginally from 14.6% in 2022-23 to 15.6% in 2025-26. 
  • Flattening Exports: Share in global goods exports has flattened since 2014-15 and remained at nearly 1.7% in 2025-26.
  • Falling Gross Fixed Capital Formation (GFCF): GFCF by the private sector as a percentage of GDP has fallen from 25.1% in 2022-23 to 23.9% in 2025-26. 
  • Underused Capacity: RBI’s data on capacity utilisation is still below 80% mark (above which companies invest to create new capacity).
  • Skewed Credit Growth: Absence of sustained rapid growth in output suggests loans are being taken to provide working capital rather than fresh investments. 
  • Stagnant Employment: Manufacturing sector’s share in total employment was largely the same in 2025-26 (12.1%) as in a decade earlier. 

Watch Video News Today

Explore Related Content

Discover more articles, videos, and terms related to this topic

RELATED TERMS

3

Working Capital

The difference between a company's current assets and current liabilities, representing the funds available for day-to-day operations. Supply chain disruptions can strain working capital requirements.

Capacity Utilisation

Capacity utilisation refers to the extent to which an industrial plant or an economy is operating at its maximum possible output level. A low capacity utilisation suggests that there is unutilized potential and could indicate weak demand or investment.

RBI

Reserve Bank of India. India's central bank, responsible for regulating the country's banking and monetary system. It plays a crucial role in financial stability and oversight of financial institutions.

Title is required. Maximum 500 characters.

Search Notes

Filter Notes

Loading your notes...
Searching your notes...
Loading more notes...
You've reached the end of your notes

No notes yet

Create your first note to get started.

No notes found

Try adjusting your search criteria or clear the search.

Saving...
Saved

Please select a subject.

Referenced Articles

linked

No references added yet